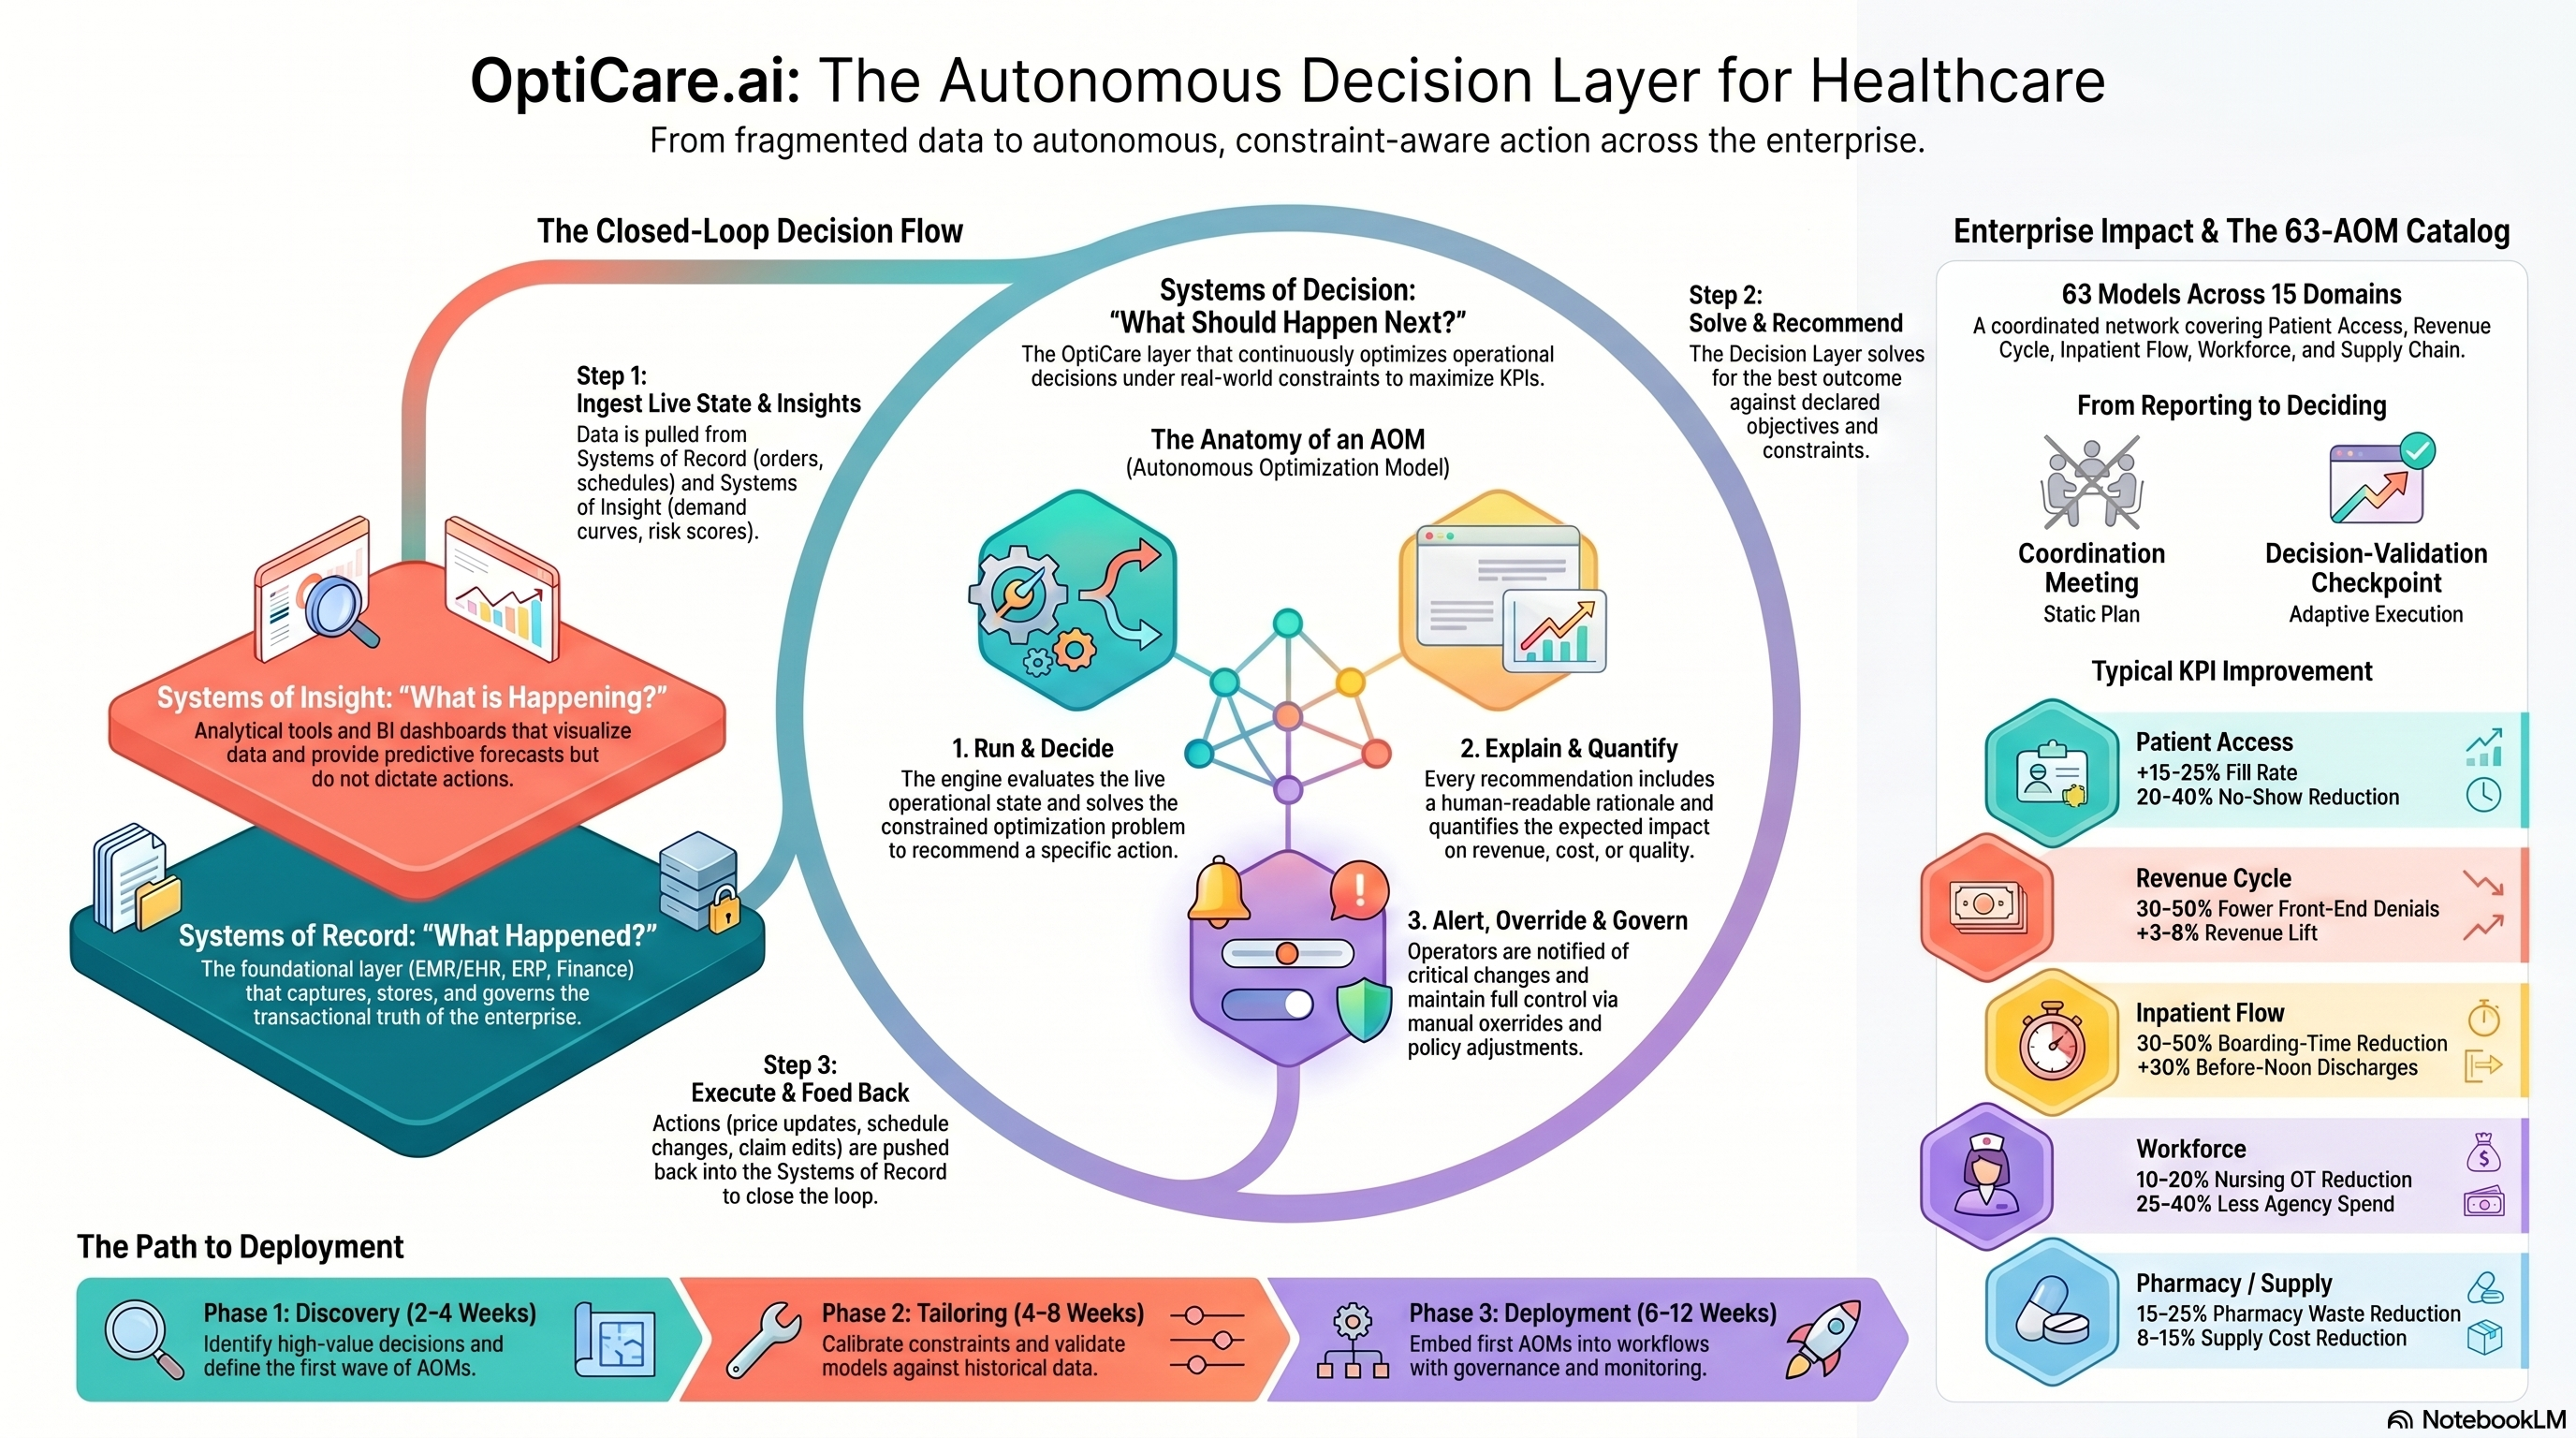
The optimization backbone for healthcare operations.
From boarding to bed assignment to denial appeals, AOMs decide the optimal next move across acute, ambulatory, and revenue-cycle operations — fully explainable, fully overridable.
Care Continuum + Revenue Cycle
Patient access, referral routing, and slot-fill optimizers.
Maximizes fill across providers under acuity and constraint rules.
Routes referrals to the best-fit provider/location balancing access and outcomes.
Predicts no-show risk and triggers right-sized overbooking.
Adjusts visit lengths to true case complexity.
Re-orders the queue to keep wait variance within target bands.
Every cluster, broken out.
Click any circle on the value chain above to jump to its cluster section.
Access & Scheduling
Patient access, referral routing, and slot-fill optimizers.
Maximizes fill across providers under acuity and constraint rules.
Routes referrals to the best-fit provider/location balancing access and outcomes.
Predicts no-show risk and triggers right-sized overbooking.
Adjusts visit lengths to true case complexity.
Re-orders the queue to keep wait variance within target bands.
ED Flow
Emergency department triage, throughput, and boarding optimizers.
Re-orders the ED queue against acuity, capacity, and SLA targets.
Predicts left-without-being-seen risk and pulls high-risk patients forward.
Optimizes provider assignment to minimize door-to-provider time.
Forecasts boarding load 4–8 hours ahead and pre-positions admit decisions.
Splits low-acuity flow to fast-track stations under staffing constraints.
Inpatient Throughput
Bed assignment, discharge prediction, and length-of-stay optimizers.
Continuously assigns beds against patient profile and unit fit.
Forecasts discharge windows and prepares downstream resources.
Pulls inpatients to floor before bed turnover finalizes — under safety constraints.
Surfaces LOS-extending barriers per case and routes them for resolution.
Optimizes inter-service transfers to maintain unit fit and acuity match.
Perioperative
OR utilization, block scheduling, and case sequencing optimizers.
Optimizes block schedules against actual case mix and turnover.
Sequences cases to minimize idle and overtime.
Reallocates underused blocks to high-utilization surgeons.
Coordinates room turnover, sterile processing, and staffing for sub-target turn time.
Discharge & Transitions
Transitions of care, post-acute routing, and readmission optimizers.
Optimizes hand-offs across acute → post-acute settings.
Scores readmit risk and triggers prevention pathways.
Routes patients to best-fit SNF based on outcomes and capacity.
Sequences orders, education, and ride coordination to align discharge ready-time.
Bed & Capacity
Capacity forecasting, diversion reduction, and surge optimizers.
Forecasts bed demand by unit and triggers flex-up.
Optimizes admit/transfer decisions to keep ED open under volume spikes.
Recommends timing of surge unit activation against forecasted census.
Identifies cross-unit flex beds and routes patients within nursing-skill bounds.
Staffing & Labor
Staffing, float-pool, and labor-cost optimizers.
Allocates nurses and techs against acuity and skills under labor budget.
Allocates float pool across units by predicted gap.
Re-sequences shifts to suppress avoidable overtime under safety floor.
Optimizes RN-to-tech ratio per unit/shift against acuity.
Pharmacy & Supplies
Pharmacy substitution, supply stocking, and med-reconciliation optimizers.
Substitutes formulary against cost, availability, and clinical equivalence.
Stocks supplies by usage and lead time.
Sequences specialty-drug PA workflows by revenue and clinical urgency.
Prioritizes med rec workload by readmit risk × med complexity.
Quality & Safety
Quality flag closure, sepsis early-warning, and safety-event optimizers.
Routes quality flags into action against measure deadlines.
Streams vitals and labs to flag sepsis hours before threshold; routes orders.
Prioritizes fall-risk patients for hourly rounding and bed-alarm coverage.
Detects HAI clustering across units; flags isolation and source-investigation actions.
Population Health
Cohort building, gap closure, and outreach optimizers.
Builds cohorts and prioritizes outreach by ROI on intervention.
Closes care gaps by sequencing outreach against likelihood-to-act.
Stratifies attributed lives by 12-month admission risk for proactive management.
Picks channel, timing, and message per patient for highest engagement lift.
Ambulatory Operations
Ambulatory throughput, provider productivity, and walk-in flow optimizers.
Optimizes ambulatory clinic flow against staff and rooms.
Levels provider load via panel-density and visit-mix tuning.
Predicts walk-in surges and pre-stages staffing/rooms.
Co-schedules labs, imaging, and procedures to consolidate visits.
Authorization & Eligibility
Authorization sequencing, eligibility, and pre-cert optimizers.
Sequences authorizations by payer SLA and revenue at risk.
Continuously re-verifies eligibility and flags coverage changes pre-service.
Predicts which orders will require pre-cert and queues them with full clinical packet.
Monitors payer portals for status changes and routes follow-ups.
Coding & Documentation
Coding completeness, DRG, and documentation-gap optimizers.
Closes documentation gaps before claim submission.
Surfaces DRG opportunity in real time during the inpatient stay.
Flags missing specificity in clinical notes against coding rules.
Routes accounts to coders by complexity, payer, and dollar value.
Denials & Appeals
Denial root-cause, appeal sequencing, and payer-specific optimizers.
Clusters denials by root cause and routes upstream fixes.
Orders appeals by recovery probability × payer SLA expiry.
Detects emerging denial patterns by payer/CPT and triggers preventive workflow change.
Selects per-payer appeal templates and supporting evidence based on win rates.
Cash & Collections
Cash posting, underpayment recovery, and self-pay optimizers.
Auto-matches remits to claims under posting rules.
Detects underpayments and queues recoveries.
Sequences self-pay outreach by likelihood-to-pay and propensity model.
Predicts bad-debt write-offs early and routes accounts to alternate channels.
Take it with you.
Infographic is yours to download. The overview and deck go out after a quick form.
Run a care optimizer, or tell Opti you're interested.
Looking for OptiU thesis content? Visit the parent site.